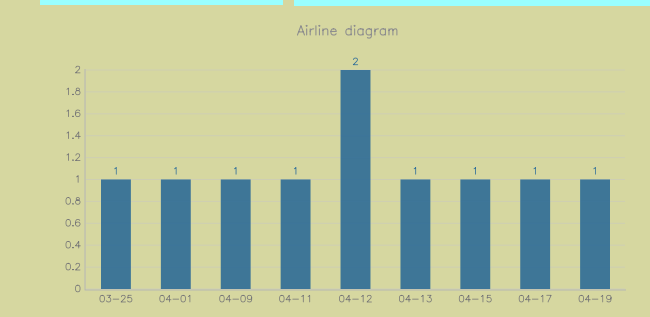
从数据库中取出最近三十天的数据并生成柱状图的代码,需要的朋友可以参考下。
在终端用cd 命令进入文件目录文章源自很文博客https://www.hinwi.com/很文博客-https://www.hinwi.com/17701.html
说明:此处例子我是拿项目中的一个例子讲解的。文章源自很文博客https://www.hinwi.com/很文博客-https://www.hinwi.com/17701.html
1、新建一个项目 :用终端输入:zf create project Airline 格式:zf create action project project-name 备注:这些格式可以在终端输入zf 查看文章源自很文博客https://www.hinwi.com/很文博客-https://www.hinwi.com/17701.html
2、新建一个action :zf create action dirgramshow index 格式:zf create action action-name controller-name文章源自很文博客https://www.hinwi.com/很文博客-https://www.hinwi.com/17701.html
3、新建一个 model :zf create db-table flightinformation文章源自很文博客https://www.hinwi.com/很文博客-https://www.hinwi.com/17701.html
action 层代码:indexController.php文章源自很文博客https://www.hinwi.com/很文博客-https://www.hinwi.com/17701.html
- public function indexAction ()
- {
- // action body
- $db = new Application_Model_DbTable_Flightinformation();
- /*获取最近30天内的数目
- * select day(boo_time) as day,count(boo_autoid)as count,boo_time from bookinformation
- where flag_pass=0 and date_sub(now(), interval 30 day)<=date(boo_time)
- group by DATE_FORMAT(boo_time,'%m %d')
- */
- $sql = "select DATE_FORMAT(boo_time,'%m-%d') as day,count(boo_autoid)as count from bookinformation " .
- "where flag_pass=0 and date_sub(now(), interval 30 day)<=date(boo_time) " .
- "group by DATE_FORMAT(boo_time,'%m %d')";
- $result = $db->getAllInfo($sql)->fetchAll();
- $this->view->result=$result;
- }
iew 层代码:dirgramshow.phtml文章源自很文博客https://www.hinwi.com/很文博客-https://www.hinwi.com/17701.html
- <!DOCTYPE html PUBLIC "-//W3C//DTD XHTML 1.0 Transitional//EN" "http://www.w3.org/TR/xhtml1/DTD/xhtml1-transitional.dtd">
- <html xmlns="http://www.w3.org/1999/xhtml">
- <head>
- <meta http-equiv="Content-Type" content="text/html; charset=utf-8" />
- <title>航班折线图</title>
- <script language="javascript" type="text/javascript"
- src="<?php
- echo $this->baseUrl() . '/skin/source/jquery/jquery.js'?>"></script>
- <script language="javascript" type="text/javascript"
- src="<?php
- echo $this->baseUrl() . '/skin/js/ZJPjscharts.js'?>"></script>
- </head>
- <body>
- <div id="graph">Loading graph...</div>
- <script type="text/javascript">
- var d=new Array();
- var color=new Array();
- <?php
- foreach ($this->result as $key => $value) {
- ?>
- d.push(new Array('<?php
- echo $value['day']?>',<?php
- echo $value['count']?>));
- color.push('#2D6B96');
- <?php
- }
- ?>
- if(d!=""){
- //['#2D6B96', '#327AAD', '#3E90C9', '#55A7E3', '#60B6F0', '#81C4F0', '#9CCEF0']
- var myData = d;
- var colors =color;
- var myChart = new JSChart('graph', 'bar');
- myChart.setDataArray(myData);
- myChart.colorizeBars(colors);
- myChart.setTitle('Airline diagram');
- myChart.setTitleColor('#8E8E8E');
- myChart.setAxisNameX('');
- myChart.setAxisNameY('');
- myChart.setAxisColor('#C4C4C4');
- myChart.setAxisNameFontSize(16);
- myChart.setAxisNameColor('#999');
- myChart.setAxisValuesColor('#777');
- myChart.setAxisColor('#B5B5B5');
- myChart.setAxisWidth(1);
- myChart.setBarValuesColor('#2F6D99');
- myChart.setBarOpacity(0.5);
- myChart.setAxisPaddingTop(60);
- myChart.setAxisPaddingBottom(40);
- myChart.setAxisPaddingLeft(45);
- myChart.setTitleFontSize(11);
- myChart.setBarBorderWidth(0);
- myChart.setBarSpacingRatio(50);
- myChart.setBarOpacity(0.9);
- myChart.setFlagRadius(6);
- myChart.setTooltip(['North America', 'U.S.A and Canada']);
- myChart.setTooltipPosition('nw');
- myChart.setTooltipOffset(3);
- myChart.setSize(616, 321);
- /*myChart.setBackgroundImage('<?php
- //echo $this->baseUrl() . '/skin/image/ZJPchart_bg.jpg'?>');*/
- myChart.draw();
- }
- </script>
- </body>
- </html>
model 层代码:Flightinformation.php
- <?php
- class Application_Model_DbTable_Flightinformation extends Zend_Db_Table_Abstract
- {
- protected $_name = 'flightinformation';
- public function getAllInfo($sql){
- $adapter = Zend_Registry::get('db');
- $flightinformation = $adapter->query($sql);
- return $flightinformation;
- }
- }
最后的效果图如下:


